Leave Your Message
In 2026, Drone Shows will become more than bright formations above a stadium. They will support tourism campaigns, product launches, national celebrations, and large cultural events. Global buyers need more than impressive videos. They need dependable technology, experienced crews, transparent pricing, and realistic delivery schedules.
This guide examines leading Drone Shows through a buyer’s practical lens. It considers fleet size, animation quality, flight duration, positioning accuracy, and nighttime visibility. It also reviews how suppliers manage wind, rain, battery changes, transport, insurance, and local permissions. A capable provider should explain each stage clearly, from the first storyboard to the final landing. Small operational details matter. A beautiful preview cannot replace a safe, rehearsed performance.
The strongest options may not be the most expensive. Some smaller fleets can create elegant stories with fewer aircraft and lower venue demands. Larger providers can deliver complex logos, moving animals, or synchronized music across wider skies. Results depend on local weather, venue shape, audience distance, and regulatory requirements. No single show fits every market.
Buyers should ask for verified case studies, technical specifications, risk plans, and references from comparable events. They should also confirm who handles permits and how schedule changes are managed. This is where many comparisons become uncertain. Marketing language can hide practical limits. A careful review should leave room for doubt, testing, and negotiation. That approach helps international buyers choose a memorable show without overlooking safety, reliability, or long-term value.
What Are the 2026 Best Drone Shows for Global Buyers?
Define “Best” Using Scale, Safety, Storytelling, Cost, and Global Reach
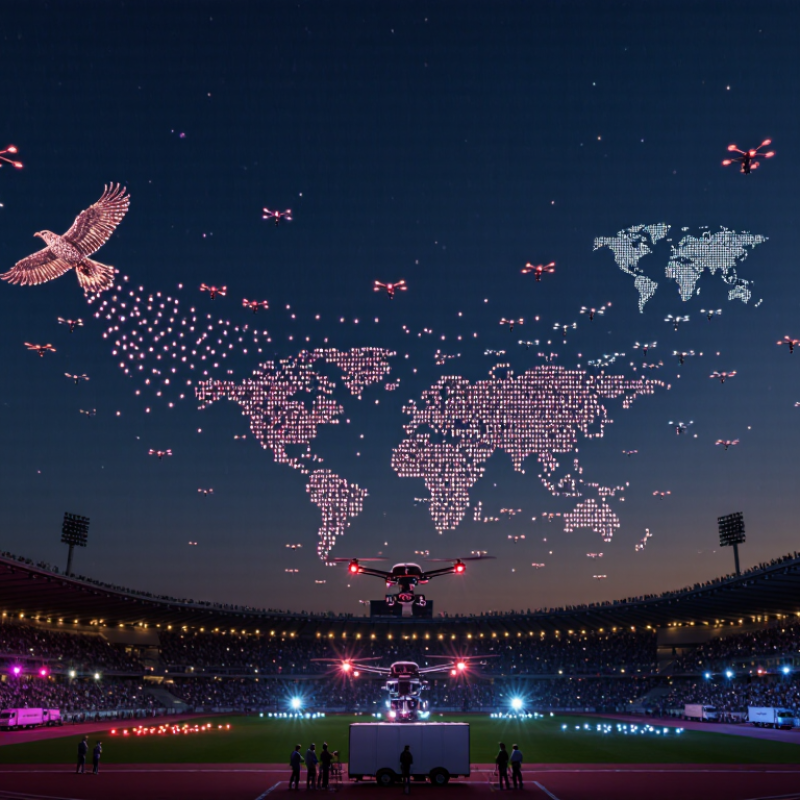
For global buyers, the best drone show is not always the largest. A strong evaluation starts with scale, including fleet size, flight height, launch space, and audience distance. Hundreds of drones may create a wide visual canvas. Thousands can produce moving animals, maps, or architectural scenes. Yet more units also require tighter testing, stronger batteries, and larger safety zones.
Safety should be measured through experience, not promises. Ask for flight records, trained operators, emergency procedures, weather limits, and local aviation approvals. Insurance matters too. A reliable team can explain what happens after a communication failure. It should also provide a rehearsal plan. Some proposals look perfect on paper. Real wind can change everything.
Storytelling separates a memorable show from a bright screensaver. The sequence should have a clear beginning, emotional shift, and visual ending. Local history, language, and cultural symbols can make the story feel more authentic. Cost includes transport, permits, crew travel, equipment, rehearsals, and backup drones. A low quote may hide important exclusions. Global reach also means adaptable logistics, multilingual coordination, and reliable technical support across time zones. I would still leave room for revision. Audience reactions are difficult to predict, and even experienced planners sometimes overestimate visual complexity.
Defining “Best” Using Scale, Safety, Storytelling, Cost, and Global Reach
| Show Format | Typical Fleet Size | Audience Capacity | Safety and Compliance Profile | Storytelling Potential | Indicative Budget Range | Global Deployment Reach | Best Use Case |
|---|---|---|---|---|---|---|---|
| Large City-Centre Spectacular | 500–1,500 drones | 50,000–500,000 spectators | Requires formal airspace coordination, geofencing, site exclusion zones, emergency procedures, and trained flight personnel. | Excellent for national celebrations, tourism campaigns, public anniversaries, and multi-scene narratives with music and animation. | Approximately US$250,000–US$1,000,000+ | High; suitable for major urban venues where aviation permissions are obtainable. | Flagship public events, destination marketing, and international media moments. |
| Large Festival and Stadium Show | 300–1,000 drones | 20,000–100,000 spectators | Strong operational control is required around stadium structures, lighting, temporary infrastructure, and crowd boundaries. | Very high; synchronized 3D formations can support performers, sporting themes, product stories, and musical finales. | Approximately US$150,000–US$600,000 | High; commonly adaptable to festivals and stadiums in multiple regions. | Music festivals, sporting events, cultural programmes, and ticketed spectacles. |
| Medium Municipal Celebration | 100–400 drones | 5,000–50,000 spectators | More manageable than city-scale operations, but still dependent on local aviation, privacy, noise, and public-event requirements. | High when the narrative is concise; ideal for local history, community identity, seasonal celebrations, and civic milestones. | Approximately US$50,000–US$200,000 | Medium to high, depending on local regulation and venue access. | City festivals, holiday programmes, tourism launches, and public ceremonies. |
| Corporate and Brand Story Show | 50–300 drones | 500–20,000 spectators | Requires controlled access, documented risk assessment, competent operators, and a venue-specific flight plan. | Excellent for short, focused narratives such as company milestones, sustainability themes, product launches, and investor events. | Approximately US$30,000–US$180,000 | High for repeatable event concepts, subject to national permissions. | Corporate hospitality, launch events, conferences, and public-relations campaigns. |
| Indoor or Enclosed Venue Show | 20–200 drones | 300–10,000 spectators | Weather exposure is reduced, but indoor navigation, ceiling clearance, fire safety, power management, and audience separation remain critical. | High precision; suitable for theatrical scenes, immersive storytelling, exhibitions, and choreographed stage productions. | Approximately US$25,000–US$150,000 | Medium; venue engineering and indoor operating permissions vary widely. | Trade shows, theatres, exhibitions, hotels, and controlled entertainment venues. |
| Waterfront and Coastal Show | 200–1,000 drones | 10,000–250,000 spectators | Requires special planning for wind, humidity, reflective surfaces, marine traffic, shoreline exclusion zones, and recovery procedures. | Very high; water reflections, music, fireworks alternatives, and maritime themes can create strong visual impact. | Approximately US$100,000–US$600,000 | High in coastal and riverside destinations, subject to weather and maritime rules. | Harbour festivals, national days, tourism campaigns, and waterfront inaugurations. |
| Sustainable Fireworks Alternative | 100–800 drones | 5,000–200,000 spectators | Can reduce smoke, debris, and explosive-material risks compared with fireworks, but aviation compliance, crowd safety, and emergency planning are still required. | High; supports longer visual sequences, logos, wildlife imagery, environmental messages, and controlled musical pacing. | Approximately US$60,000–US$450,000 | High where authorities permit night operations and outdoor drone flights. | Events seeking lower local emissions, reduced debris, or quieter visual effects. |
| Tourism Destination Signature Show | 300–1,200 drones | 20,000–300,000 spectators | Needs multi-agency coordination when landmarks, protected areas, airports, or dense visitor zones are involved. | Outstanding; landmark silhouettes, local legends, cultural icons, and destination stories can be combined into a repeatable signature production. | Approximately US$150,000–US$800,000+ | Very high for destinations with established event infrastructure and airspace access. | Destination branding, visitor-season openings, cultural festivals, and annual events. |
| Small-Scale Demonstration Show | 20–100 drones | 100–5,000 spectators | Operational complexity is lower, but the same principles of competent operation, pre-flight checks, weather assessment, and audience separation apply. | Moderate to high for concise messages, product demonstrations, education, and proof-of-concept performances. | Approximately US$15,000–US$75,000 | Very high for pilots, private venues, and markets with limited event scale. | Buyer demonstrations, pilot projects, private celebrations, and market testing. |